
Write For Us
We Are Constantly Looking For Writers And Contributors To Help Us Create Great Content For Our Blog Visitors.
Categories
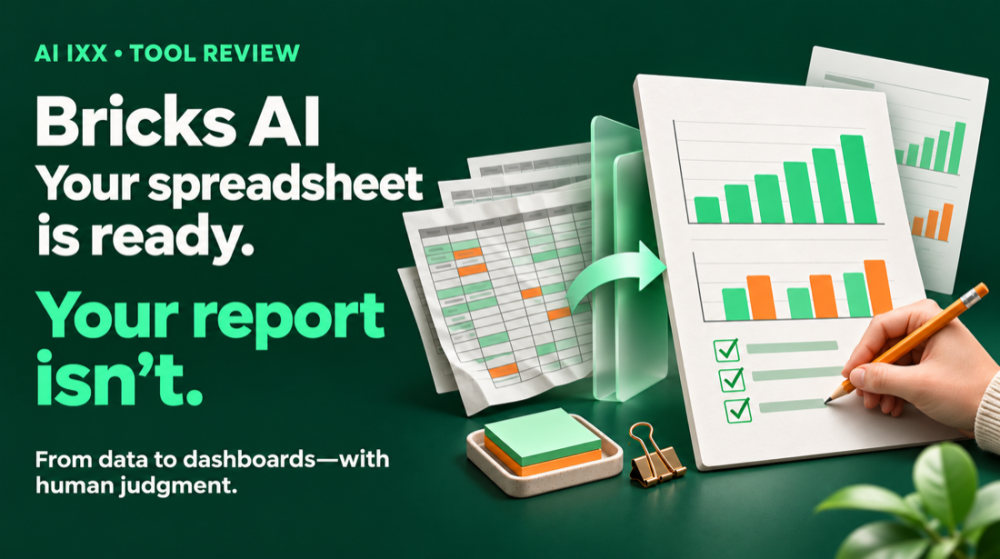
Bricks AI Review: Your Spreadsheet Is Ready. Your Report Isn’t.
The meeting starts in an hour. You have the sales figures, the regional breakdown, and a spreadsheet with enough tabs to qualify as a small browser.
What you don’t have is a report anyone can understand at a glance.
So the next hour becomes a familiar ritual: build a chart, fix the labels, move it into a presentation, discover the numbers changed, and quietly consider a career involving fewer rectangles.
Bricks is an AI tool built for that gap between having data and having something useful to show people. It turns uploaded business data into dashboards, charts, and reports you can edit. Its appeal is easy to understand: less time assembling the report, more time deciding what the numbers mean. Bricks
But a polished dashboard can still tell the wrong story. The interesting question is how much work Bricks removes—and which parts still need you.
What is Bricks AI?
Bricks combines a spreadsheet, a visual workspace, and an AI assistant. Your data lives in tables. The AI helps analyze it and build charts. The dashboard brings those charts together with figures, explanations, and other report elements. Bricks
Think of it as a colleague who can take your spreadsheet and assemble the first version of your presentation. You still need to explain what matters to the meeting.
That makes it an appealing candidate for marketing reports, sales reviews, inventory summaries, and small-business reporting. These jobs often start with a spreadsheet export and end with someone asking, "Can you make this easier to read?”
You can guide the output in ordinary language, then adjust it yourself. Bricks supports prompted chart changes and manual customization, including rearranging dashboard elements and changing their appearance. thebricks.com
How it works: give the report a job
Let’s use a simple business example. You run a small online store and want a monthly sales review. Your spreadsheet contains order dates, products, regions, revenue, and refunds.
Bricks’ documented dashboard flow starts with uploading your files, adding optional instructions, and generating the dashboard. It supports Excel and CSV files, along with PDFs and images. You can also select relevant sheets from a workbook. Bricks
The instructions are where you should spend a little effort. "Make a dashboard” gives the software a design task. A better prompt gives it a business question:
That last part matters. A beautiful chart covering the wrong month is still the wrong chart. It just arrives wearing a nicer suit.
See what happens when you give the report a specific job
Once the first version is ready, check a few figures against the spreadsheet. Does total revenue match? Did the report include canceled orders? Are all amounts in the same currency? These are your review steps, even when the AI handles the layout.
Then refine the presentation. Perhaps the regional comparison needs more space, or the product chart needs fewer categories. Bricks gives you both AI instructions and direct editing controls for that cleanup. thebricks.com
The feature I’d watch: next month’s report
The first dashboard is the demo. The second month is the business case.
Bricks connects dashboard charts and tables to the data in its spreadsheet grids. When you update that source data, the connected visuals can refresh automatically. Its data actions let you replace a table or add new rows; matching column headers matter. Bricks
That is useful for recurring work. A marketing manager could maintain a campaign report, a sales lead could update a pipeline review, and an operations team could reuse an inventory dashboard.
There is one easy-to-miss detail: refreshing the charts does not mean the written insights have been rewritten. Bricks’ documentation points users to a separate Generate Insights action for updated commentary. Bricks
So if this month’s figures turn downward, check that the summary has stopped celebrating last month’s growth. A dashboard arguing with its own headline is a memorable way to start a meeting.
Load Month 2 data below—then see why you must also click "Generate Insights"
"🎉 Record-Breaking Month! Sales Surge +14% Across All Weeks!”
The chart bars automatically dropped when you pasted November's numbers into the grid—but this written summary box is still celebrating October's growth! Click "3. ✨ Click 'Generate Insights'" above to fix it before the meeting starts.
Also, an uploaded CSV is a snapshot. The automatic refresh described here happens when the source tables inside Bricks change. Getting fresh information into those tables remains part of your reporting process.
Where Bricks still needs a human
Your spreadsheet needs some manners
Bricks’ dashboard guide warns that missing headers and merged cells can prevent generation. It recommends consistent dates and numbers, clear sheet names, and avoiding blank rows. Bricks
That is a useful reality check. A file full of "final,” "final new,” and "actually final” tabs needs a little adult supervision before you ask AI to explain it.
The current import guide also specifies files under 25 MB and up to 100,000 rows. That gives you a concrete boundary to test against before planning a large reporting project. Bricks
Good charts depend on good definitions
Revenue, profit, and cash received are different measures. A tool cannot safely decide which one your boss meant by "how much we made.” Define the metric before judging the chart.
The same goes for explanations. If sales rose after a campaign, the spreadsheet may show the timing. It does not necessarily prove the campaign caused the increase. Treat generated commentary as a draft analysis to check.
Bricks’ own terms acknowledge that AI output can contain errors and make users responsible for verification. Bricks
Sharing deserves a deliberate choice
Bricks supports PDF and PowerPoint exports, presentation mode, and public links. Those public links require no login, so use the appropriate access setting when a report contains internal information. Bricks
For client work, test the actual exported file early. The finished PDF or slide deck is what the client receives; its readability matters as much as the dashboard inside the app.
Bricks AI pricing: what you actually need to budget
These are the prices shown on Bricks’ main pricing cards when checked on November 5, 2026. Prices are in US dollars, per user. Bricks
| Plan | Monthly billing | Monthly equivalent with annual billing | AI allowance |
|---|---|---|---|
| Free | $0 | $0 | 20 messages/month |
| Premium | $25 | $17.50 | 200 messages/month |
| Pro | $100 | $70 | Unlimited messages |
| Enterprise | Custom | Custom | Confirm in quote |
Each AI request counts as a message, including requests to change a chart. If you hit your allowance, AI features pause until it resets or you upgrade; manual tools remain available within your plan. Bricks
Budget for Premium if downloadable reports are central to your work. The billing comparison places exports on paid plans. Some landing pages describe free exports, so check the option in your account. Premium’s current card includes PDF, PPTX, XLSX, and HTML exports; Pro adds advanced connectors and embeddable dashboards. Bricks
For PDF-heavy work, confirm import charges too: the import guide lists one AI credit per PDF page or image, without explaining how those credits map to the monthly message allowance. Bricks
Team limits also differ across the pricing cards and FAQs. Confirm the workspace entitlement before buying seats. For a solo user, I’d test one real report on Free before committing to an annual subscription. Bricks
How many AI messages will your monthly reporting use?
Privacy and terms, in plain English
You keep ownership of the material you upload and create. Bricks’ privacy policy says uploaded content is not used to train general, public, or third-party AI models. Its terms preserve an exception for improving your individual experience within your account, so the wording is more specific than "no training of any kind.” Bricks
Third-party AI providers still process content to produce results. The published terms place storage in US AWS data centers and describe retention for up to 90 days after account termination. The privacy policy also allows longer retention of personal information for legal and business needs. Bricks
For an initial trial, a report with unnecessary customer identifiers removed is a sensible starting point. Company approval still matters when uploading confidential business data.
Subscriptions can be canceled through account settings, generally taking effect at the end of the billing cycle. The terms say fees already paid are nonrefundable unless otherwise specified. Bricks
Our verdict: a useful shortcut for recurring reports
Bricks looks most compelling for the person who regularly turns spreadsheet exports into something colleagues or clients can read: a marketing manager, a sales lead, an agency owner, or the small-business operator who somehow became the entire reporting department.
Its combination of generated layouts, editable visuals, and connected data gives it a practical role. The limits are equally clear: you still need clean inputs, agreed definitions, checked calculations, and current commentary.
My suggested first test is straightforward. Use last month’s report, where you already know the right answers. Build it in Bricks, verify the important totals, and then update it with a second period of data. See how much work remains.
If that second report takes meaningfully less effort, you have a reason to pay. If your existing template is already quick and reliable, the subscription may add very little.
The win is getting your report ready while you still have time to think about what it says.


Subscribe to our Newsletter
 AI IXX Learn
Discover AI.
Learn Faster.
Build the Future.
Download Now!