
Best AI for Infographics: Create Visuals in 20 Seconds
Creating infographics used to be time-consuming, requiring hours of design work and a strong sense of aesthetics. Now, with the rise of AI for infographics, it’s possible to generate one in 20 seconds or less. These AI tools simplify the process and, with just a few clicks, transform raw data into visually appealing graphics. Here, we’ll explore some of the best AI-based infographic generators to help you quickly and effectively create engaging visual content.
1. Napkin.ai
This is one of the most straightforward tools available for turning complex information into simple visuals. It’s ideal if you want to create a quick, clean infographic without getting bogged down in design details.
How to Use Napkin.ai: Step-by-Step
Here's a quick guide on how you can use Napkin.ai to generate an infographic.
1. Get Information From ChatGPT
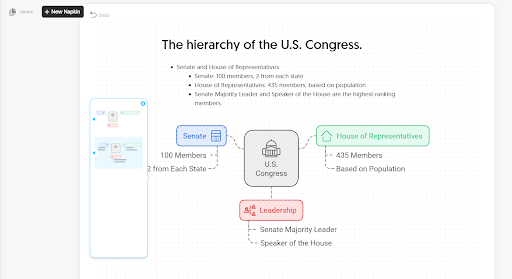
First, decide what kind of data you want to visualize. Let’s say you want to create an infographic on the hierarchy of the U.S. Congress.
Open up ChatGPT, you can use any version available to you, and ask: "Give me the hierarchy of the U.S. Congress."
ChatPT will return something like this:
Senate and House of Representatives
- Senate: 100 members, 2 from each state
- House of Representatives: 435 members, based on population
- Senate Majority Leader and Speaker of the House are the highest-ranking members.
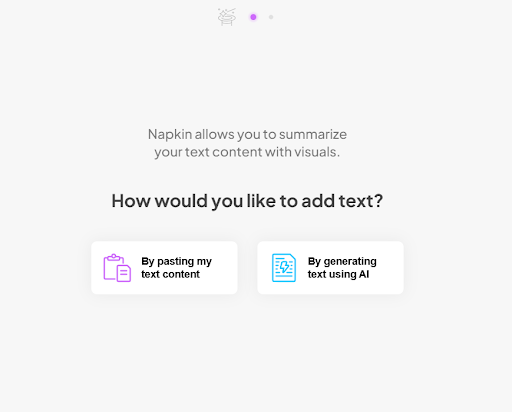
2. Sign Up and Paste Information
If you don’t already have an account, registration is quick and allows Google or email sign-up. Then head over to Napkin.ai, and use the option of AI infographic generator from text. Paste the information from ChatGPT into the text box. Click the Generate Infographic button. In just a few seconds, Napkin.ai processes your text and produces a visual outline or infographic that illustrates the hierarchy you described.
3. Customize the Look
Napkin.ai generates a simple infographic, but you can make adjustments if needed. It gives a variety of images and you can choose the best fit. Add a header or modify the structure to match your needs.
4. Download or Export
Once satisfied with the design, click Download to save the image file to your device. Now you have a crisp, easy-to-understand infographic.
2. Piktochart's Generative AI
This tool has long been known as a go-to tool for creating infographics. Recently, they've added AI-generated infographic features to streamline the process even more. Now, you can generate an infographic based on text inputs, making it incredibly easy to visualize information.
How to Use Piktochart's Generative AI: Step by Step
Here is how you can use Piktochart’s Generative AI.
1. Gather the Information
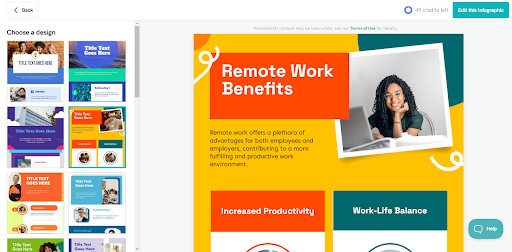
Suppose you want to create an infographic about the benefits of remote work. Go to ChatGPT and ask: "What are the benefits of remote work?"
You might get an answer like:
- Increased Productivity: Remote environments reduce office distractions, allowing employees to focus and produce more efficiently. Fewer interruptions mean more work gets done in less time.
- Better Work-Life Balance: No commute gives employees extra time for personal activities, improving well-being. Flexible hours help maintain a healthy balance between work and personal life.
- Reduced Commuting Time: Eliminating daily commutes saves time and reduces stress, allowing workers to start their day refreshed. This also cuts transportation costs.
- Access to a Larger Talent Pool: Companies can hire from anywhere, not just locally. This expands opportunities to attract top talent from around the world.
2. Open Piktochart's AI Tool
Navigate to Piktochart's Generative AI page.
- Sign in or create a free account if you don’t have one yet.
- Click on the Infographic icon and select the Generative AI option.
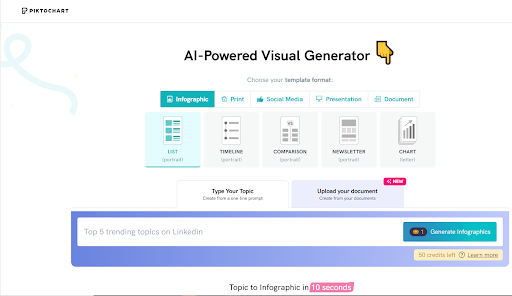
3. Input Your Data
Copy the list of remote work benefits from ChatGPT and paste it into the text box in Piktochart. Then click "Generate Infographic” and within seconds, the tool will generate a structured infographic that visually presents the benefits of remote work.
4. Customize the Template
Piktochart's AI will generate a base design, but you can still make changes to suit your style, like, Change the colors, fonts, and layout. You can also add images or icons from Piktochart’s library to enhance the design.
5. Export Your Infographic
Once the infographic looks the way you want, click "Export” to download the final design in a format of your choice (PNG, PDF, or PPT).
3. Venngage's AI Infographic Generator
Another popular infographic creation tool that has added AI-powered infographic generation is Venngage's AI Infographic Generator. It helps you create visuals based on your content, whether it's a business report, marketing stats, or educational data.
How to Use Venngage's AI Infographic Generator: Step-by-Step
1. Collect Your Data
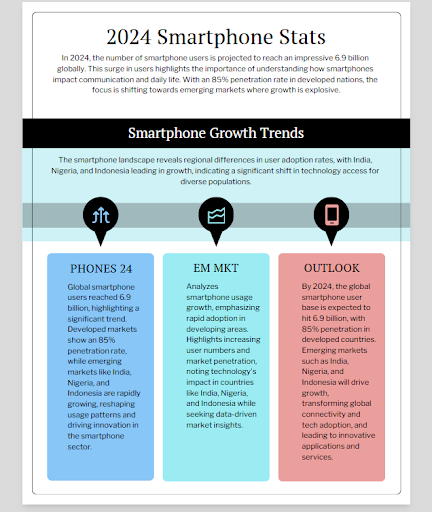
Imagine you want to visualize data about global smartphone usage. Use ChatGPT to gather quick insights. Here is a prompt: "What are the global statistics on smartphone usage in 2024?"
ChatGPT will provide a list like this:
- 6.9 billion smartphone users worldwide
- 85% penetration rate in developed countries
- Fastest-growing markets: India, Nigeria, and Indonesia
2. Go to Venngage's Infographic Generator
Go to the tool’s website, Venngage's AI Infographic Generator.
- Log in or create an account to access the AI tools.
- Choose the "AI Infographic Generator” from the available options.
3. Enter Your Information
Copy and paste the smartphone usage statistics from ChatGPT into the input box. Hit "Generate”, and in seconds, the tool will produce a detailed infographic based on the data you provided.
4. Adjust the Design
Venngage’s AI will give you a starting point, but it’s fully customizable. Here’s what you can do.
- Change the layout, fonts, or colors.
- Add visual elements like icons or charts.
- Include a headline such as "Global Smartphone Usage in 2024.”
5. Download Your Infographic
Once you’ve made all the adjustments, click "Download” to save your infographic as an image or PDF file.
Add Finishing Touches in Canva
Even after generating your infographic in tools, you might want to tweak the design further. Canva is a fantastic platform to fine-tune your visual with additional elements like backgrounds, images, or icons.
Steps to Enhance Your Infographic in Canva
To add finishing touches to your infographic in Canva, upload your visual and use Canva’s extensive design tools to enhance it. Here are some ways to polish your infographic:
- Adjust Layouts and Spacing: Use Canva’s drag-and-drop tools to refine the positioning of elements, ensuring a balanced, visually appealing layout.
- Add Icons and Illustrations: Canva offers thousands of icons, shapes, and illustrations. Incorporate these to emphasize key points and add depth to your design.
- Customize Colors and Fonts: Align colors and fonts with your brand or aesthetic using Canva's color and typography options. This consistency helps make your infographic more professional and engaging.
- Use Text Effects: Experiment with text effects like shadows, outlines, and curved text to highlight headings or key stats.
- Incorporate Data Visuals: Add charts, graphs, or diagrams to better represent data and make complex information more digestible.
Final Word
Creating infographics used to be a labor-intensive task, but now you can create infographics with AI using powerful tools like these, generating clean, professional visuals in less than 20 seconds. As the best AI infographic generator options continue to improve, summarizing complex data, explaining a process, or creating visual reports has become even faster. These tools enable you to produce high-quality infographics that communicate your message effectively—no graphic design experience is needed.


